
Netrics Dashboard
Web interface for visualizing Internet performance measurements
Overview
The Netrics Dashboard is a web interface for visualizing measurements collected from deployed Netrics devices. It provides real-time and historical views of Internet performance metrics.
Features
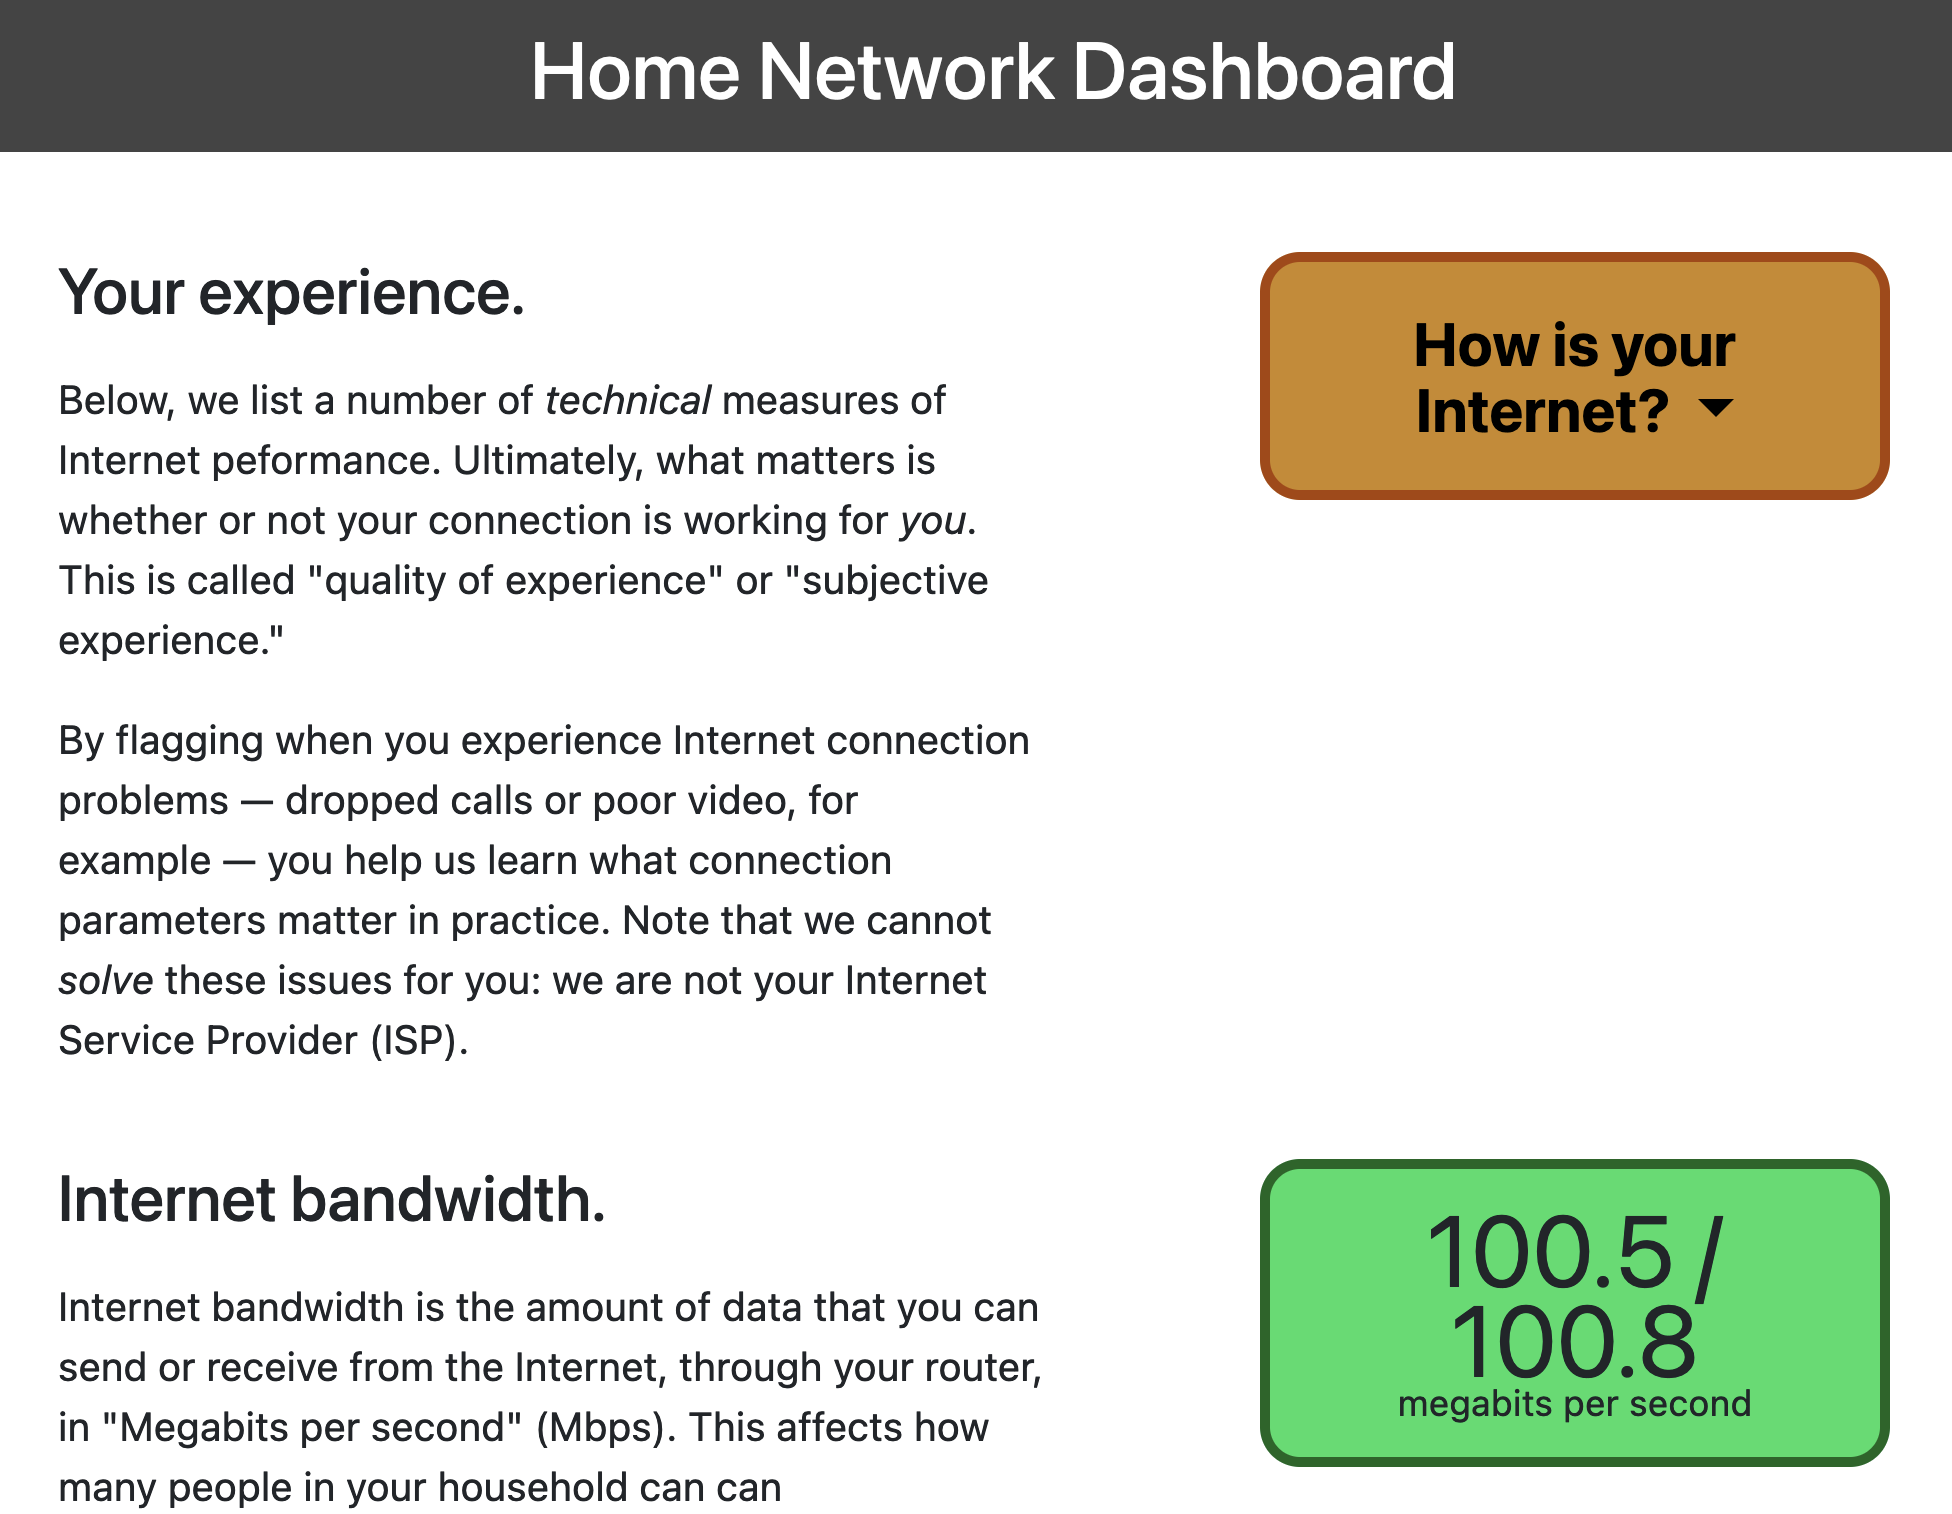
- Bandwidth Visualization: Track download and upload speeds over time
- Latency Monitoring: View ping times and DNS response latencies
- Device Metrics: Monitor connected devices and WiFi performance
- Historical Analysis: Explore trends and patterns in your Internet service
Access
Participants in the FLOTO project receive access to a private dashboard where they can view their performance in real-time.
Repository
- netrics-dash - Dashboard source code
Backend Infrastructure
The dashboard is powered by:
- Data Pipeline: AWS S3 storage for raw measurement data
- Visualization: InfluxDB time-series database with Grafana dashboards
- Fleet Management: Salt Stack for device updates and monitoring